Analytics
Tigermeeting analytics instantly generates live reports and answers the questions that HR and IT managers often wonder about:
- how the meeting rooms are used?
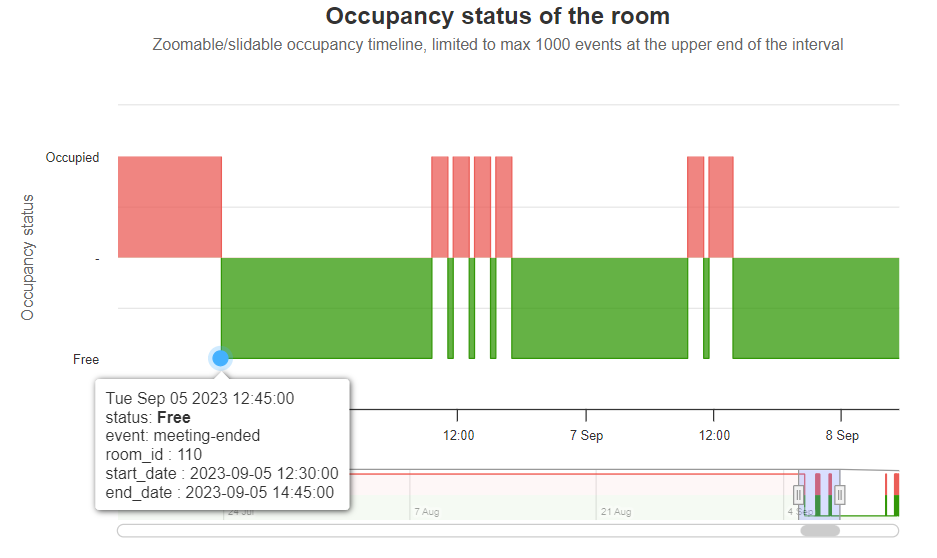
- what is the occupancy of the meeting rooms?
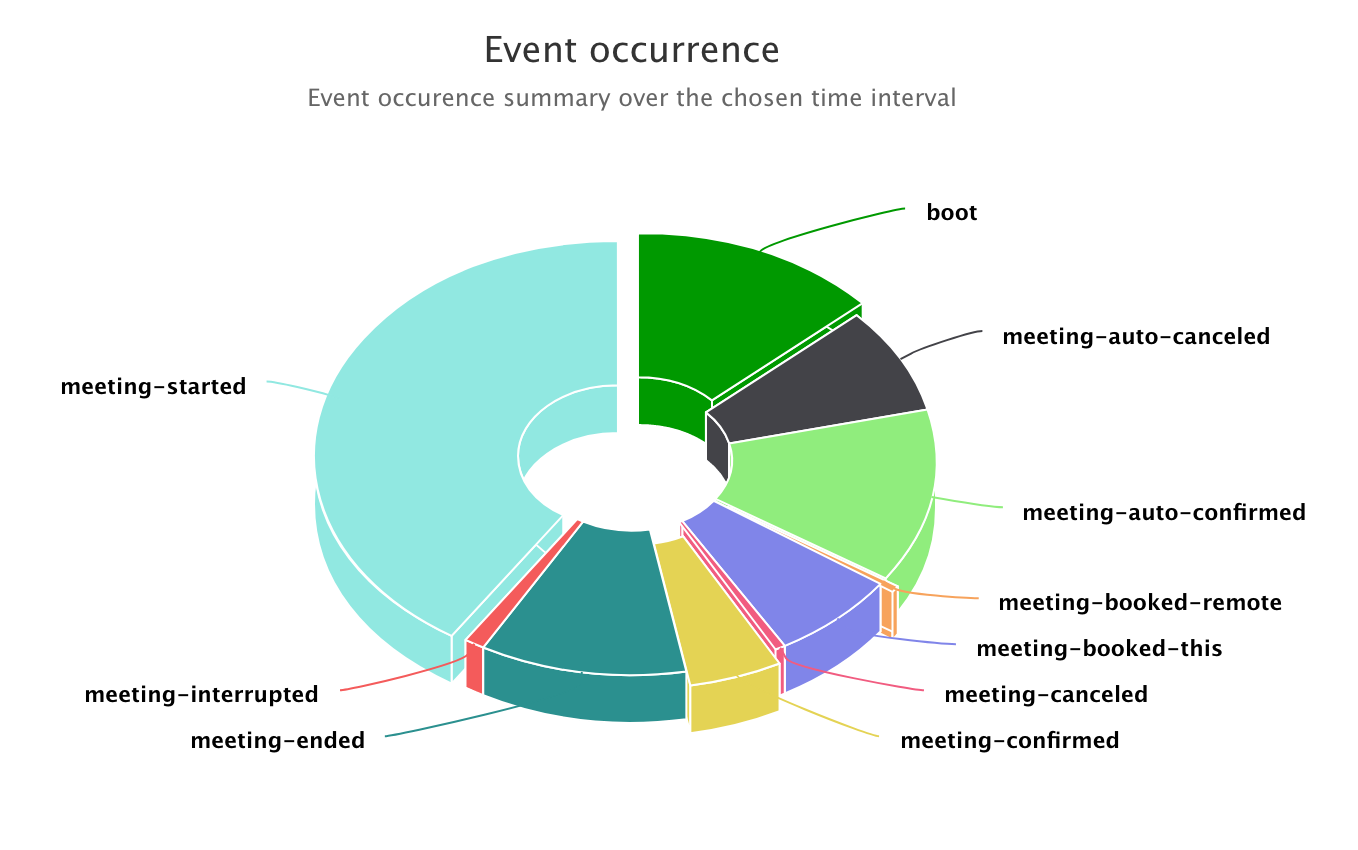
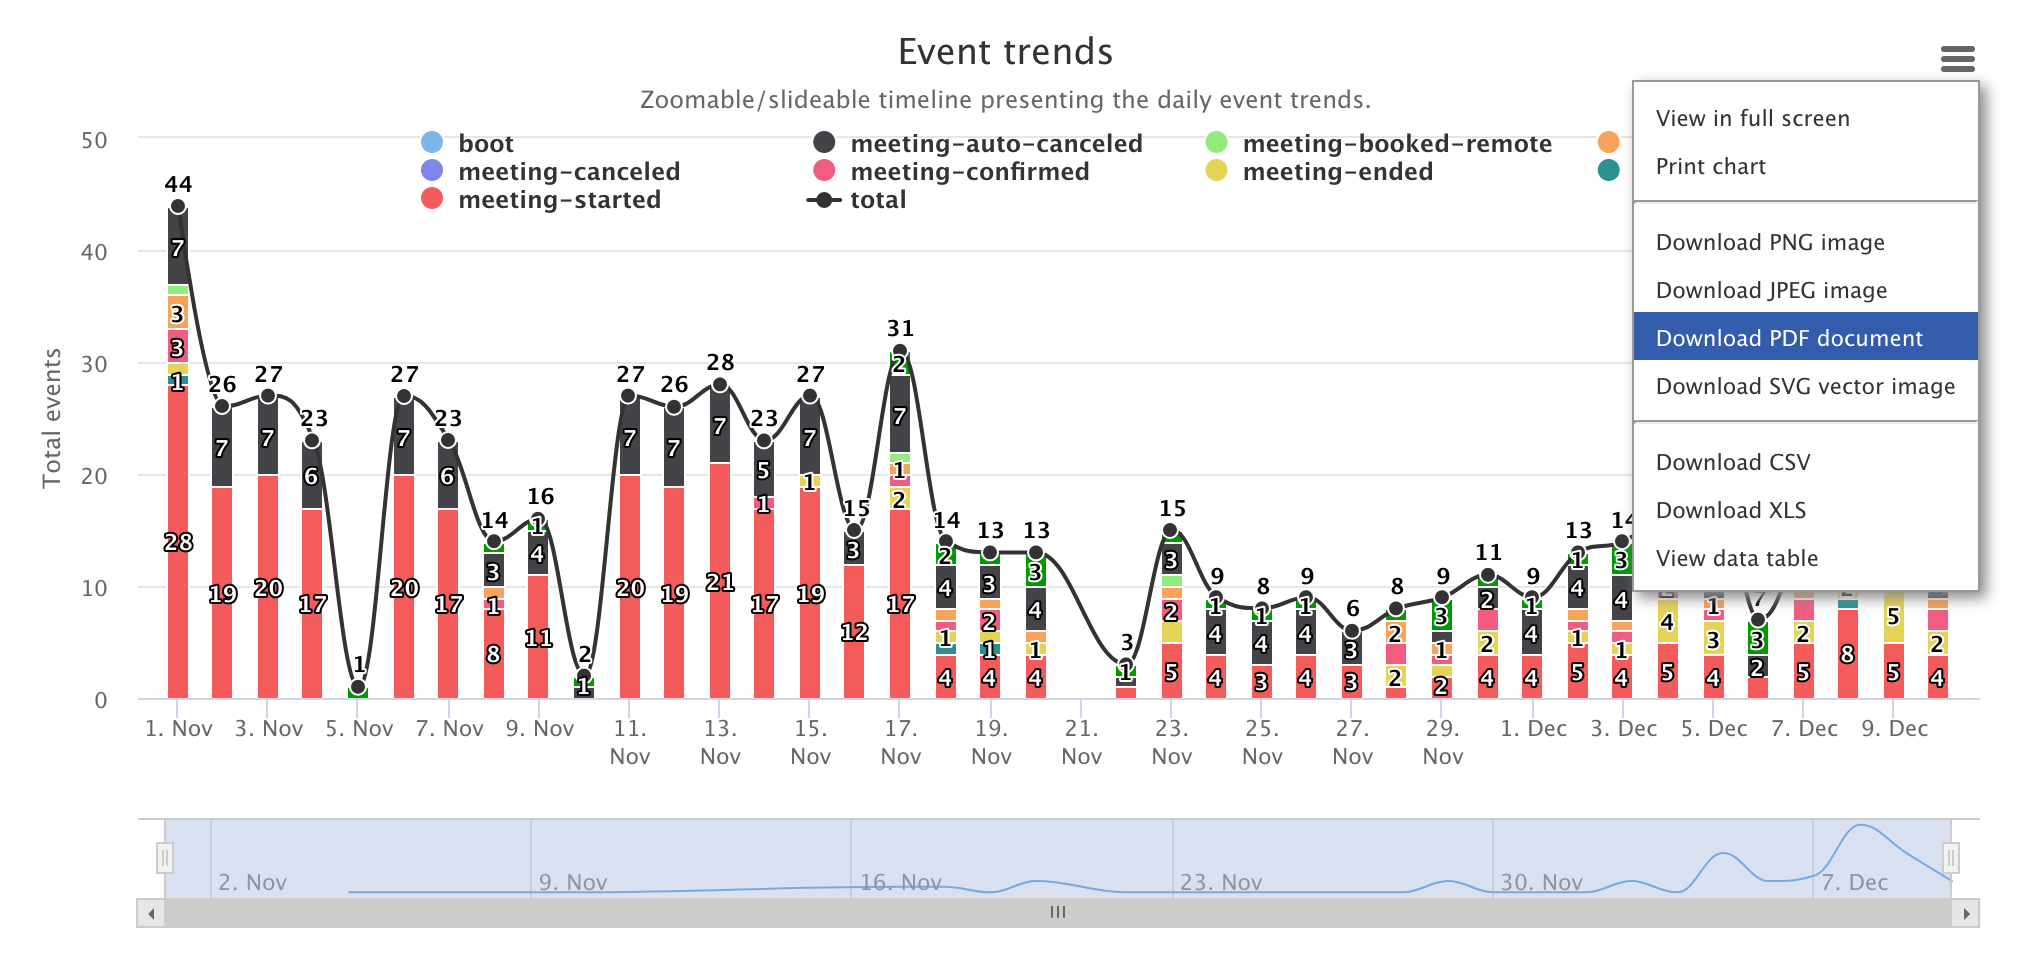
- what are the booking trends in the comapny?
- are there any peek hours or more popular meeting rooms?
- what is the company's meeting culture?
- do booked meetings indeed occupy the meeting rooms?
- what is the network usage of a meeting room?
- is there any disk space left on the booking screens?
- are the screens overheeting?
If the Analytics feature is turned ON, Tigermeeting applications - booking screens, overview screens and the Admin app collect the meeting related events and the device metrics on an anonymous way, that is the basis for the Tigermeeting Analytics data.
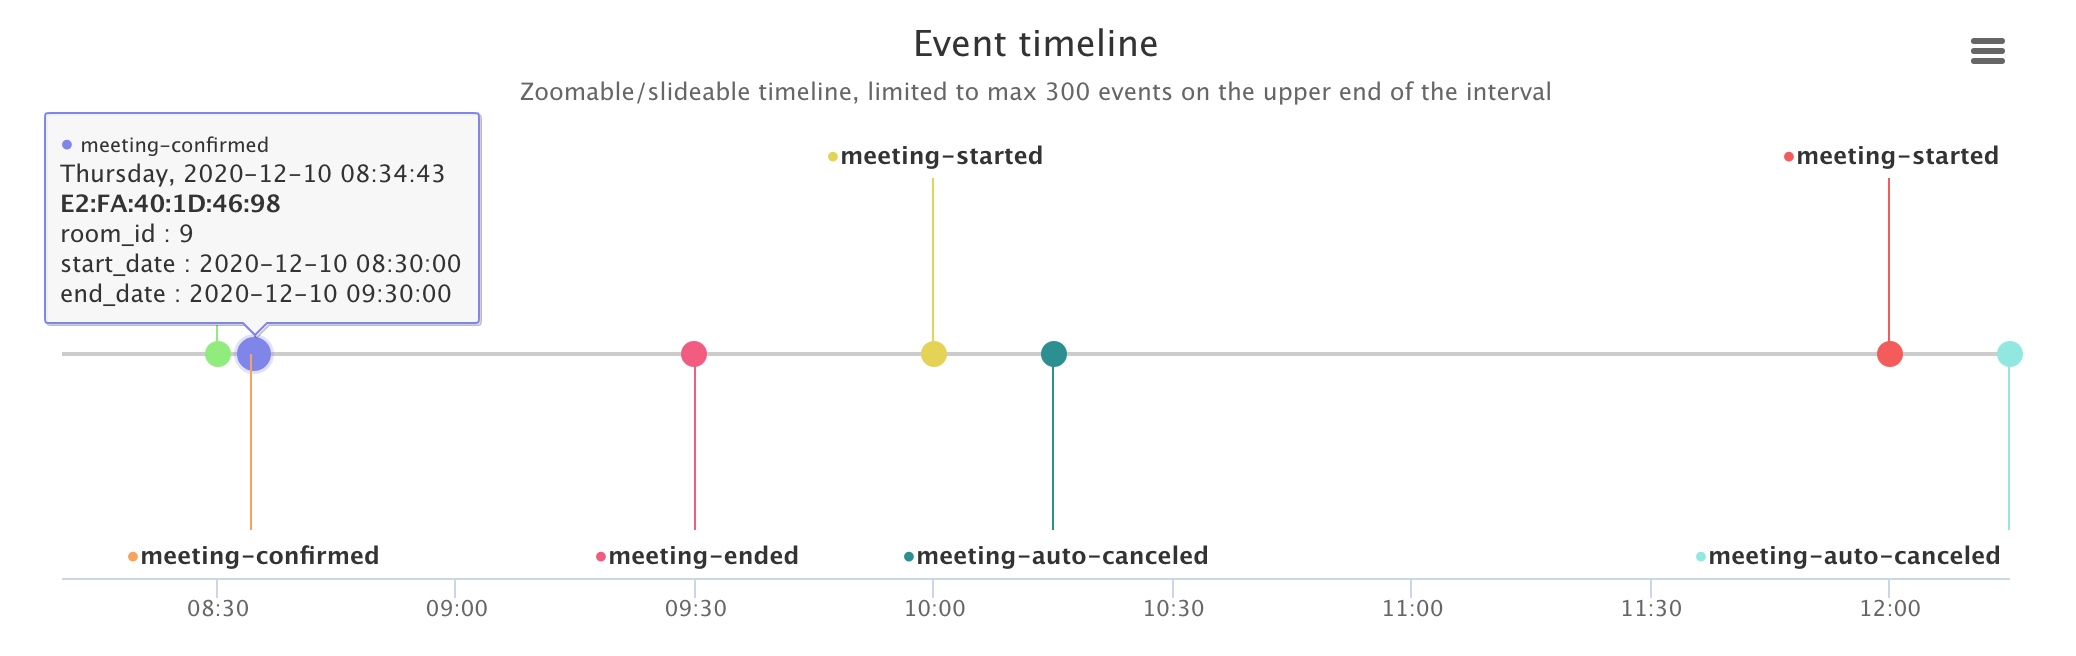
Example data analytics presentations:
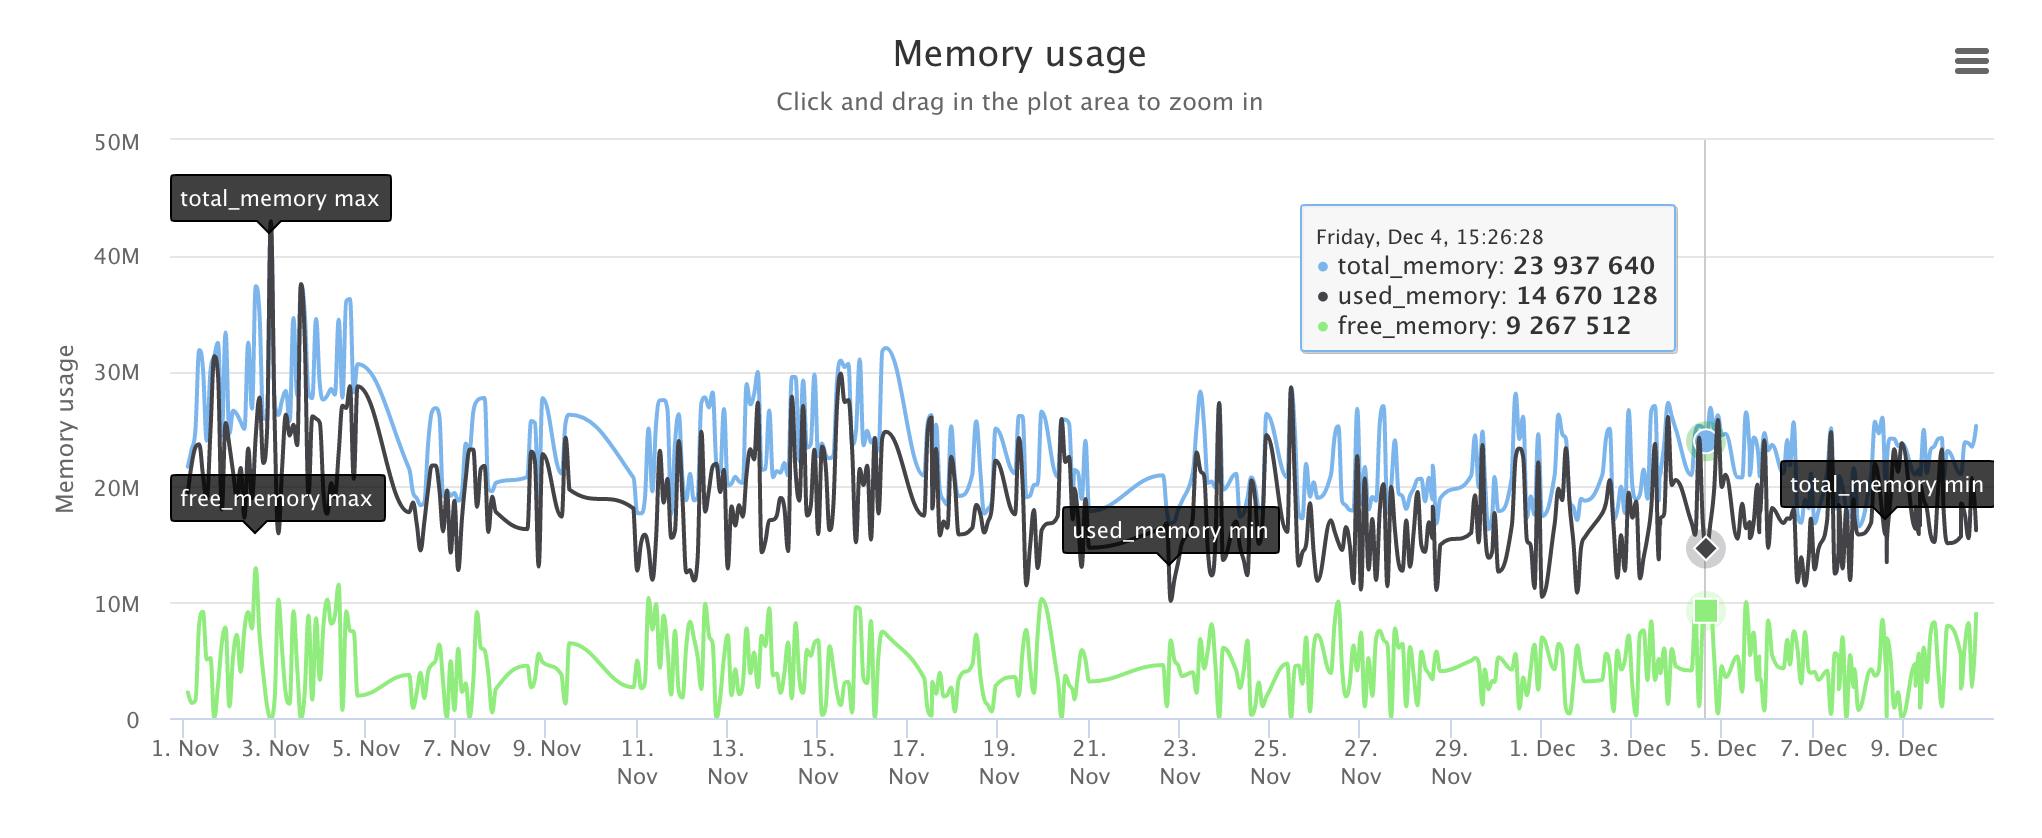
...also hardware related data like CPU usage, frequency, temeprature, memory, network and storage usage:
The underlaying data can be exposed in the Admin app for further BI integrations via CSV file format exports and printing.
The data is handled anonymously and tiead to the devices' MAC address or Android ID only and do not contain any meeting related information (like user, location, room etc).
For more information, please read the Tigermeeting Privacy Policy that complies with the GDPR, CCPA, PIPEDA, CDR, LGPD and POPI regulations.
Read more about the privacy and technical solution in the Tigermeeting GDPR complance statement.
Note: AI Assistant does not have access to any analytics data, therefore it is not possible to use the AI assistent for analysis of the analytics data .